Gold Price Today –
3 June 2026
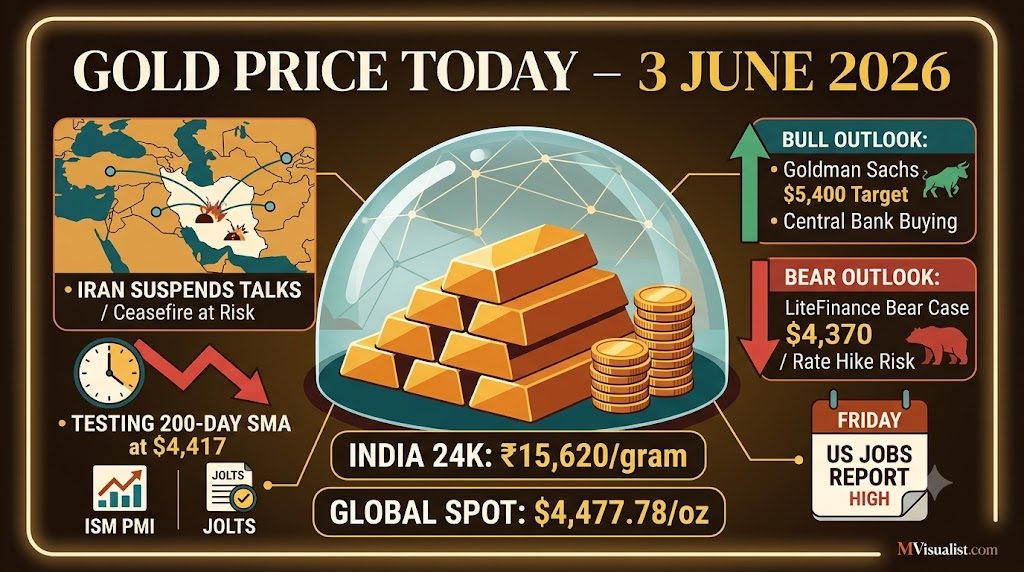
Iran suspended communications with Washington after Israeli attacks in Lebanon — putting the ceasefire extension in serious jeopardy. Gold has fallen to $4,477.78 (−0.27%) — now testing the critical 200-day SMA support at $4,417. India’s 24K gold is at ₹15,620/gram (₹1,56,200/10g). Today brings ISM Services PMI and JOLTS job openings. Friday’s US Jobs Report is the week’s dominant event. Here is your complete Wednesday morning brief.
Iran Suspends Washington Communications — Ceasefire Extension in Serious Jeopardy
Iranian media reported on June 2 that Tehran suspended communications with Washington in response to Israeli attacks in Lebanon. This dramatic escalation effectively pauses the diplomatic channel through which the ceasefire MOU was being negotiated. The suspension follows weeks of talks where Iran and the US were reportedly close to finalising a 60-day truce extension that would reopen the Strait of Hormuz. However, President Trump separately stated that discussions are “still ongoing” and that an MOU could be reached “as early as next week” — contradicting Iran’s suspension announcement and keeping the situation fluid.
Aaj ka sone ka bhav — Wednesday, 3 June 2026. India’s 24K gold is at ₹15,620/gram (₹1,56,200/10g) nationally — down ₹1/gram from yesterday. Chennai remains higher at ₹15,818/gram. Globally, gold has fallen to $4,477.78 — below $4,500 and approaching the critical 200-day SMA at $4,417. The driver: Iran suspended communications with Washington. Today brings ISM Services PMI and JOLTS job openings. Friday’s Non-Farm Payrolls will set gold’s near-term direction for June 2026.
💰 Gold Rate Today India — 3 June 2026
Goodreturns (showing June 3 update, down ₹1 from June 2): 24K = ₹15,620/gram, 22K = ₹14,318/gram, 18K = ₹11,715/gram. Chennai (Goodreturns city-specific) remains elevated: 24K ₹15,818/gram, 22K ₹14,500/gram, 18K ₹12,180/gram. MissionKiAwaaz confirms the average across major portals: ₹15,600–₹15,900/gram for 24K on June 3. Sunday Guardian confirmed domestic 24K is hovering around ₹1.56 lakh/10g range.
City-Wise Gold Rates — 3 June 2026
| City | 24K (₹/10g) | 22K (₹/10g) | 18K (₹/10g) | 24K/gram |
|---|---|---|---|---|
| Delhi | ₹1,56,200 | ₹1,43,180 | ₹1,17,150 | ₹15,620 |
| Mumbai | ₹1,56,200 | ₹1,43,180 | ₹1,17,150 | ₹15,620 |
| Chennai | ₹1,58,180 | ₹1,45,000 | ₹1,21,800 | ₹15,818 |
| Kolkata | ₹1,56,200 | ₹1,43,180 | ₹1,17,150 | ₹15,620 |
| Bengaluru | ₹1,56,200 | ₹1,43,180 | ₹1,17,150 | ₹15,620 |
| Hyderabad | ₹1,56,200 | ₹1,43,180 | ₹1,17,150 | ₹15,620 |
| Ahmedabad | ₹1,56,200 | ₹1,43,180 | ₹1,17,150 | ₹15,620 |
| Pune | ₹1,56,200 | ₹1,43,180 | ₹1,17,150 | ₹15,620 |
| Jaipur | ₹1,56,200 | ₹1,43,180 | ₹1,17,150 | ₹15,620 |
| Lucknow | ₹1,56,200 | ₹1,43,180 | ₹1,17,150 | ₹15,620 |
| Surat | ₹1,56,200 | ₹1,43,180 | ₹1,17,150 | ₹15,620 |
| Patna | ₹1,56,200 | ₹1,43,180 | ₹1,17,150 | ₹15,620 |
*Rates from Goodreturns (3 June 2026). Exclude 3% GST and making charges. Chennai carries a traditional premium (₹1,980/10g above national). All rates include India’s 15% import duty (effective May 13, 2026). Average across MissionKiAwaaz/portals: ₹15,600–₹15,900/gram. Verify with your jeweller before purchase.
Today, three sources show slightly different rates: Goodreturns ₹15,620/gram (retail jeweller survey), MissionKiAwaaz ₹15,600–₹15,900/gram range (compiled from Goodreturns + LiveMint), and PolicyBazaar ₹15,141/gram (Rapid API — different data source/methodology). For physical jewellery purchases, use Goodreturns retail rates. For investment tracking, use IBJA/Goldmeter. The Sunday Guardian’s ₹1.56 lakh/10g aligns with Goodreturns national average. All rates exclude 3% GST and making charges.
📊 MCX Gold Today — Technical Levels & 200-day SMA
MCX gold is expected to open Wednesday in the ₹1,53,500–₹1,56,500/10g range, reflecting international spot at $4,477 converted at approximately ₹95.19/USD with India’s 15% import duty structure. The critical level to watch is the 200-day SMA equivalent at approximately ₹1,52,000–₹1,54,000/10g on MCX — this is the long-term bull market line. As long as MCX holds above this, the broader uptrend is intact.
Gold’s Moving Average Structure — Corrective Phase, Bull Trend Intact Above 200-day
FXStreet specifically warned: gold is “looking to test the key 200-day SMA support at $4,417 amid bearish daily RSI.” If gold closes below $4,417, it would be the first close below the 200-day SMA since the US-Iran conflict began — a major technical bear signal. MCX equivalent: ~₹1,52,000–₹1,54,000/10g. For long-term investors, a test and bounce of the 200-day SMA is historically a powerful buy signal. For short-term traders, do not hold open long positions aggressively below $4,477 until the 200-day SMA test outcome is clear.
🌍 International Gold Spot Price — 3 June 2026
Trading Economics confirms: gold fell to $4,477.78 on June 3, 2026 — down 0.27% from the previous day. This is the first time gold has been convincingly below $4,500 since the ceasefire extension optimism drove it to $4,563 on Friday May 30. Over the past month gold is now down 1.00% and +32.76% year-on-year. FXStreet confirms a similarly soft $4,481.09 reading.
“Gold traded below $4,500 per ounce on Tuesday after declining in the previous session, pressured by stalled peace negotiations between the US and Iran that kept inflation risks and interest rate expectations at the forefront. On Monday, Iranian media reported that Tehran had suspended communications with Washington in response to Israeli attacks in Lebanon.” — Trading Economics, June 3, 2026
| Metric | Value | Source / Context |
|---|---|---|
| Today’s spot (June 3) | $4,477.78 (−0.27%) | Trading Economics |
| FXStreet spot | $4,481.09 | Bearish bias below SMAs |
| Sunday Guardian (June 3) | $4,481/oz | Live market update |
| 1-month change | −1.00% | Trading Economics |
| YoY change | +32.76% | Trading Economics |
| 21-day SMA | $4,601 (above current) | FXStreet — bearish signal |
| 50-day SMA | $4,648 (above current) | FXStreet — bearish signal |
| 200-day SMA (CRITICAL) | $4,417 (below current) | FXStreet — bull floor |
| RSI (14) | ~43 — subdued | FXStreet — not extreme bearish |
| ATH (Jan 28, 2026) | $5,602.22 | APMEX |
🕌 Iran Situation — Complete Analysis & 3 Scenarios for Gold
The Iran ceasefire situation has become highly complex — with both an escalation signal (Iran suspended Washington communications) and a de-escalation signal (Trump says MOU could come “next week”) in the same 24-hour period. Here is the full picture:
Iranian media reported Tehran halted communications with Washington after Israeli attacks on Lebanon. Iran treats Lebanon as part of the ceasefire framework; the US and Israel disagree. This is the most serious diplomatic breakdown since the April 8 first ceasefire.
Trump separately stated discussions are “still ongoing” and a memorandum of understanding to reopen the Strait of Hormuz could come “as early as next week.” This contradicts Iran’s suspension claim and suggests back-channel diplomatic efforts continue even if official communications paused.
FXStreet confirmed: “continued hostilities between Israel and Lebanon thwart the ceasefire arrangement in the Middle East.” Iran demands Lebanon is included in any ceasefire; the US-Israel position is that Lebanon and the Iran nuclear deal are separate issues. This fundamental disagreement is the primary obstacle to the MOU.
FXStreet’s weekly outlook noted: “The blockade of the Strait of Hormuz over the past two and a half months has significantly reduced the amount of oil available globally. The use of regional bypass, and the release of commercial stocks and strategic reserves are only partial and temporary solutions.” Crude oil at $94.68 (down from $120 peak) reflects partial market adjustment but sustained tension.
3 Scenarios for Gold Based on Iran Outcome
| Scenario | Probability | Gold Reaction (USD) | MCX India |
|---|---|---|---|
| 🕊️ A: MOU Signed Next Week | 25–35% | Immediate dip to $4,380–$4,417 (safe-haven unwind), then medium-term rally as rate cuts return. Net: gold at $4,800+ by Q3 2026. | MCX tests ₹1,52,000 short-term, then rallies |
| 🔄 B: Talks Continue, No Resolution | 45–55% | Gold holds in $4,417–$4,580 range. Jobs Report Friday determines which end of the range. Most likely scenario this week. | MCX holds ₹1,52,000–₹1,57,000 |
| 💥 C: Full Escalation Resumes | 15–25% | Gold spikes to $4,700–$5,000+. US strikes Iran or Israel escalates → safe-haven spike. Oil to $110–$120+. | MCX jumps ₹1,60,000–₹1,65,000+ |
📰 Top News Moving Gold Today
Trading Economics confirmed: “Iranian media reported that Tehran had suspended communications with Washington in response to Israeli attacks in Lebanon.” This is a significant diplomatic breakdown that has pushed gold below $4,500 for the second consecutive session. However, Trump said discussions are “still ongoing” — suggesting back-channel communication continues despite the public suspension. The situation is highly fluid and could resolve or deteriorate rapidly, making gold extremely sensitive to any Iran-related headlines this week.
Two major US data releases today: (1) ISM Services PMI for May — consensus expects above 50 (expansion). FXStreet weekly preview noted: “Unless these figures unexpectedly drop into the contraction region, investors are likely to ignore them and scrutinize the inflation component of PMI surveys, the Prices Paid Index.” (2) JOLTS Job Openings — key pre-cursor to Friday’s NFP. Higher job openings reinforce economic strength, supporting rate hike narrative — bearish for gold. Lower openings suggest labor market cooling — bullish for gold.
FXStreet confirmed gold is “looking to test the key 200-day SMA support at $4,417 amid bearish daily RSI.” At $4,477.78 today, gold is only $60 above this critical level. The 200-day SMA has not been broken since early 2026 when gold was on its way to the January ATH. A daily close below $4,417 would be the first major technical breakdown of the 2026 bull market and could trigger institutional selling. Every long-term gold investor should watch this level closely today and Thursday.
The US Non-Farm Payrolls for May 2026 releases Friday June 6 at 8:30 AM ET (6:00 PM IST). This is the single most critical event for gold this week — and possibly the most important single data point for June 2026 direction. FXStreet’s weekly forecast stated: “the critical US Nonfarm Payrolls (NFP) data due on Friday could also help alter Fed rate expectations and determine the Gold price direction in the coming weeks.” Weak payrolls + Iran escalation = gold to $4,645+; Strong payrolls + MOU signed = gold to $4,380 test.
🚨 Today’s Events + Jobs Report Friday
📊 June 2026 Gold Outlook — Bulls vs Bears
Iran escalation resumes → safe-haven gold spikes to $4,700–$5,000. Weak Jobs Report Friday → stagflation confirmed → rate hike probability falls → gold above $4,582 SMA. 200-day SMA holds at $4,417 → institutional buyers step in → technical bounce. Goldman Sachs $5,400 year-end remains intact.
Iran MOU signed + oil falls sharply → inflation eases → Fed December hike priced in firmly → dollar surges → gold closes below 200-day SMA $4,417 → institutional selling cascade → gold toward LiteFinance bear case $4,186–$3,816 by year-end. Strong Jobs Report amplifies this scenario.
Gold oscillates between $4,417 (200-day SMA support) and $4,580 (21-day SMA resistance) for most of June. Iran talks drag on without full resolution. Jobs Report is close to consensus. LiteFinance June estimate of $4,516 month-end remains the most probable outcome. India’s 15% duty keeps domestic prices at ₹1,52,000–₹1,57,000/10g floor.
🔮 Gold Price Forecast 2026 — Updated Targets
Despite the near-term pressure, the long-term bull case remains: gold is 19.2% below the January ATH, central banks are buying every dip (PBoC 8T in April), and Goldman Sachs maintains $5,400 year-end. The key risk is LiteFinance’s updated bear case of $4,370–$3,816 if rate hikes materialize under Warsh.
| Institution | Target (USD) | India 24K (₹/10g) | Timeframe |
|---|---|---|---|
| Goldman Sachs | $5,400/oz | ~₹1,76,000 | End 2026 |
| LiteFinance June | $4,186–$4,933 | ~₹1,37,000–₹1,61,000 | June 2026 range |
| LiteFinance month-end | $4,516 | ~₹1,47,500 | June 30 |
| Bull trigger (escalation + weak NFP) | $4,650–$4,760 | ~₹1,52,000–₹1,56,000 | This week |
| Bear trigger (MOU + strong NFP) | $4,380–$4,417 | ~₹1,43,000–₹1,44,000 | This week |
| Critical technical floor | $4,417 (200-day SMA) | ~₹1,44,000 | Right now |
*India estimates at USD/INR ~₹95.19, 15% import duty + 3% GST base. All forecasts are analyst estimates.
💼 How to Buy Gold in India This Week
-
SGBs — Best Long-Term Entry: Testing 200-day SMA = Historical Buy Zone
The 200-day SMA test at $4,417 is historically one of the most reliable long-term gold buy signals. SGBs access international gold prices (bypassing India’s 15% import duty) — at ~$4,477 currently equivalent to ~₹13,680/gram vs. ₹15,620/gram retail. With Goldman Sachs targeting $5,400 and the 200-day SMA holding, SGBs at this level have historically outperformed significantly over a 2–3 year horizon. Check RBI’s website for the next SGB tranche date — this week’s volatility is an opportunity to accumulate at lower international prices. -
Gold ETF SIP — Best for Navigating This Week’s Volatility
With ISM Services today, JOLTS today, ADP + Jobless Claims Thursday, and NFP Friday — gold could move ±₹2,000–₹4,000/10g across this week. A monthly SIP in HDFC Gold ETF, SBI Gold ETF, or Nippon India Gold ETF eliminates all timing decisions. Set the SIP execution for any date — you’ll average across the week’s swings. Zero making charges, tracks international price (duty-efficient), SEBI regulated. -
Wait for 200-day SMA Test Outcome Before Lump Sum
Gold is testing the 200-day SMA at $4,417 — the most important technical level of the month. If it holds (price bounces from ~$4,417): this is a historically significant buy signal for a larger lump-sum entry. If it breaks below $4,417: wait for a confirmed reversal back above before buying aggressively. Do not make a large one-time physical purchase before the Friday NFP — the outcome could significantly change prices in either direction. -
Physical Gold — Complete Before Thursday Noon if Urgent
At ₹15,620/gram + 3% GST + making charges, physical gold remains duty-elevated. If you have an urgent need (wedding, festival): (1) complete before Thursday noon to avoid NFP Friday volatility; (2) use old-gold exchange route at certified stores; (3) BIS Hallmark HUID receipt mandatory; (4) consider 18K or 14K alternatives for lower costs. For investment purposes only: SGBs and ETFs remain superior to physical by ₹1,500–₹2,000/gram at current duty levels.
The 200-day SMA at $4,417 has been above gold’s price precisely once in the past 12 months — during the brief dip in early 2026 before the Iran war began. Every time gold has tested and held its 200-day SMA in the past 5 years, it has subsequently rallied significantly over the following 3–6 months. If gold bounces from the $4,417–$4,450 zone this week (ahead of or after Friday’s NFP), it would be one of the most powerful technical buy signals of 2026 for long-term SGB and ETF investors.
❓ Frequently Asked Questions
On 3 June 2026, India’s 24K gold is approximately ₹15,620/gram (₹1,56,200/10g) nationally per Goodreturns — down ₹1 from yesterday. Chennai is higher at ₹15,818/gram. 22K is ₹14,318–₹14,500/gram depending on city. The average across major Indian financial portals is ₹15,600–₹15,900/gram. All rates exclude 3% GST and making charges. International gold is at $4,477.78 (−0.27%).
Aaj 3 June 2026 ko 24 carat sone ka national bhav approximately ₹15,620 per gram (₹1,56,200/10g) hai — kal se ₹1/gram neeche. Chennai mein ₹15,818/gram hai. International gold $4,477.78 par hai — $4,500 se neeche. Iran ne Washington se communications suspend ki hain. Ye rates indicative hain — 3% GST aur making charges alag lagte hain.
Trading Economics confirmed: “Iranian media reported that Tehran had suspended communications with Washington in response to Israeli attacks in Lebanon.” This breakdown in diplomatic contact paused the ceasefire MOU negotiation that had briefly pushed gold to $4,563 on Friday May 30. With the Iran peace deal stalled, gold’s safe-haven premium is being squeezed by: (1) diplomatic setback reducing hope for oil price relief; (2) continued rate-hike expectations from US inflation at 3.8%; (3) gold technically below 21-day and 50-day SMAs. However, Trump says MOU is still possible “next week,” so the situation remains fluid.
The 200-day Simple Moving Average (200-day SMA) at $4,417 is gold’s most important long-term technical support level — representing the average closing price over the past 200 trading days. Gold is currently $60 above this level at $4,477. As long as gold holds above $4,417, the bull market is technically intact. A confirmed daily close below $4,417 would be a major technical bear signal — the first such breakdown of 2026’s bull cycle. FXStreet notes the RSI is only ~43 (not extreme), meaning the downside momentum is “subdued” rather than in panic mode. For long-term SGB/ETF investors: a 200-day SMA test and bounce is historically one of the best long-term gold buy opportunities.
Gold testing its 200-day SMA at $4,417 — 19.2% below the January 2026 ATH of $5,602 — is historically a strong long-term entry point. Goldman Sachs maintains $5,400 year-end; the structural bull drivers (Iran, inflation, central bank buying) remain. However: (1) Friday’s Jobs Report could push prices ±₹3,000/10g; (2) If gold breaks below $4,417 this week, prices could fall further toward $4,186 before recovering. Best approach: Set up a Gold ETF SIP or acquire SGBs in the next SGB tranche rather than a one-time physical purchase this week. Consult a SEBI-registered financial advisor for personalised guidance.
We’ll monitor the 200-day SMA test today and publish gold’s complete Non-Farm Payrolls reaction on Friday evening (after 6 PM IST) on our WhatsApp Channel and Telegram. Daily gold & silver rates, Iran updates & import duty news every morning!