Gold Price Today –
2 June 2026
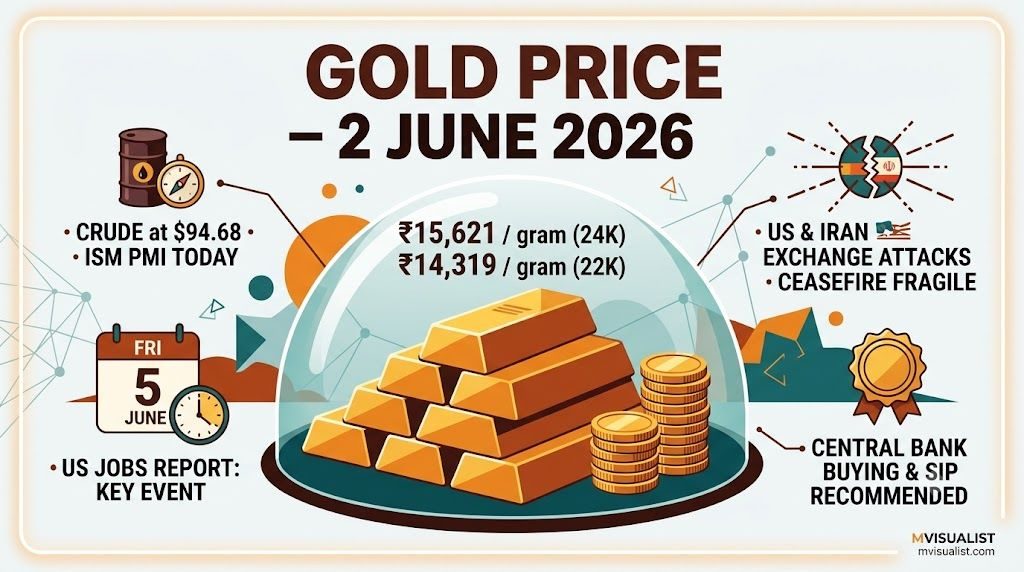
The fragile US-Iran ceasefire extension is unravelling — the US and Iran exchanged attacks on Monday, Israel extended Lebanon operations, and Iran’s parliament speaker vowed retaliation for “US non-compliance.” Gold reversed Friday’s rally and fell back to $4,522 — technically vulnerable below $4,582–$4,628 resistance. India’s 24K gold is at ₹15,621/gram (₹1,56,210/10g) nationally. ISM Manufacturing PMI releases today. The US Jobs Report arrives Friday.
Ceasefire Unravelling: US-Iran Exchanged Attacks Monday — MOU Still Unsigned
The fragile ceasefire extension that briefly lifted gold to $4,590 on Friday is falling apart. FXStreet confirmed: “The US and Iran exchanged attacks earlier on Monday, and Israel extended its occupation in Lebanon, adding strain to a frail ceasefire in the region. US President Donald Trump is still due to sign the memorandum of understanding that would extend the truce, while in Iran, the speaker of the parliament vowed retaliation to ‘clear evidence of US non-compliance with the ceasefire.'” Gold fell back from Monday’s opening high near $4,590 to the $4,500 area as a result.
Aaj ka sone ka bhav — Tuesday, 2 June 2026. India’s 24K gold is at ₹15,621/gram (₹1,56,210/10g) nationally per Goodreturns, with Mumbai at ₹15,622/gram and Delhi at ₹15,637/gram. Globally, gold at $4,522 is below its 21-day SMA ($4,582) and 50-day SMA ($4,628) — technically in a corrective phase, though holding above the critical 200-day SMA at $4,411. The Iran ceasefire is fraying fast. ISM Manufacturing PMI releases today. The US Jobs Report (Non-Farm Payrolls) arrives Friday at 6 PM IST — the week’s dominant event.
💰 Gold Rate Today India — 2 June 2026
Goodreturns (2 June 2026, sourced from reputed jewellers):
City-Wise Gold Rates — 2 June 2026
| City | 24K (₹/10g) | 22K (₹/10g) | 18K (₹/10g) | 24K/gram |
|---|---|---|---|---|
| Delhi | ₹1,56,370 | ₹1,43,350 | ₹1,17,320 | ₹15,637 |
| Mumbai | ₹1,56,220 | ₹1,43,200 | ₹1,17,170 | ₹15,622 |
| National Avg | ₹1,56,210 | ₹1,43,190 | ₹1,17,160 | ₹15,621 |
| Chennai | ₹1,57,970+ | ₹1,44,810+ | ₹1,18,480+ | ₹15,797+ |
| Kolkata | ₹1,56,210 | ₹1,43,190 | ₹1,17,160 | ₹15,621 |
| Bengaluru | ₹1,56,210 | ₹1,43,190 | ₹1,17,160 | ₹15,621 |
| Hyderabad | ₹1,56,210 | ₹1,43,190 | ₹1,17,160 | ₹15,621 |
| Ahmedabad | ₹1,56,210 | ₹1,43,190 | ₹1,17,160 | ₹15,621 |
| Pune | ₹1,56,210 | ₹1,43,190 | ₹1,17,160 | ₹15,621 |
| Jaipur | ₹1,56,210 | ₹1,43,190 | ₹1,17,160 | ₹15,621 |
| Lucknow | ₹1,56,210 | ₹1,43,190 | ₹1,17,160 | ₹15,621 |
| Surat | ₹1,56,210 | ₹1,43,190 | ₹1,17,160 | ₹15,621 |
*Rates from Goodreturns (2 June 2026). Exclude 3% GST and making charges. Delhi is ₹16/gram above national average. Mumbai is ₹1/gram above national. Chennai carries a traditional ₹1,760/10g premium. All India rates embed the 15% import duty (effective May 13, 2026). Verify with your local jeweller before purchase.
Goodreturns sidebar confirmed: Sensex 74,267.34 (−0.68%) · Nifty 23,378.70 (−0.72%) · Silver ₹2,79,900/kg · Petrol ₹111.18 · Diesel ₹97.83 · LPG ₹912.50 · Crude Oil $94.68 · USD/INR ₹95.19. Equities falling −0.68% while gold holds above ₹15,600 confirms gold’s portfolio protection function. Crude at $94.68 (down from $120 high last week) has eased marginally on ceasefire dialogue — this is the primary reason gold hasn’t rallied further.
📊 MCX Gold Rate Today — Technical Levels & SMA Analysis
MCX gold is expected to trade with a mildly bearish short-term bias today, consistent with FXStreet’s technical analysis: “XAU/USD looks vulnerable whilst below $4,582–$4,630 supply zone.” However, the critical long-term support — the 200-day SMA at $4,411 — is well below current prices, meaning the broader uptrend is still intact. Today’s key catalyst is the US ISM Manufacturing PMI — a weak reading would push gold higher; a strong reading would strengthen the dollar and deepen the pullback.
XAU/USD: Corrective Phase Within a Broader Uptrend
🌍 International Gold Spot Price — 2 June 2026
FXStreet confirms XAU/USD at $4,522.25 on 2 June 2026. Gold briefly touched $4,590 on Friday May 30 (Iran ceasefire extension reports) but dived back to the $4,500 area on Monday June 1 after the US-Iran attacks and Israel’s Lebanon escalation. Gold “reverted Friday’s gains” (FXStreet, June 1) by returning to the $4,500 area “following rejection at the $4,590 resistance area.”
| Metric | Value | Source / Context |
|---|---|---|
| Today’s spot price | $4,522.25 | FXStreet (June 2) |
| Friday May 30 high | $4,590 area | Ceasefire extension rally |
| Monday June 1 reversal | Fell to $4,500 | US-Iran attacks; Israel Lebanon |
| 21-day SMA (Resistance) | $4,582.65 | FXStreet — price below this |
| 50-day SMA (Resistance) | $4,628.82 | FXStreet — price well below |
| 200-day SMA (Support) | $4,411.29 | FXStreet — price above ✓ |
| LiteFinance June 2026 range | $4,186–$4,933 | LiteFinance forecast |
| LiteFinance June 2 outlook | Price expected to decline | LiteFinance daily |
| LiteFinance June month-end | $4,516 | LiteFinance estimate |
| YoY change (global) | +34.31% | Trading Economics |
| ATH (Jan 28, 2026) | $5,602.22/oz | APMEX |
“Gold is holding the previous pullback from two-week highs of $4,595 early Monday, as buyers struggle to find a fresh impetus amid looming uncertainty surrounding the ceasefire extension deal between the United States and Iran. Technically, Gold struggles to take out the key resistance zone as momentum remains bearish.” — FXStreet Gold Price Forecast, June 2, 2026
🕌 Iran Ceasefire — The Dominant Wildcard for Gold
The Iran situation has become more complex — and more dangerous — over the past 48 hours. Here is the complete picture as of June 2, 2026:
FXStreet confirmed: “The US and Iran exchanged attacks earlier on Monday” — directly undermining the ceasefire framework that Iran and the US had spent the prior week negotiating. This is the most serious escalation since the April 8 ceasefire was first brokered.
Trump must sign the Memorandum of Understanding extending the ceasefire for 60 days. Axios reported Trump wanted to “reinforce multiple points of the deal” — particularly what to do with Iran’s nuclear material. Until Trump signs, the ceasefire extension is not in effect.
Israel extended its occupation in Lebanon simultaneously with US-Iran attacks — “adding strain to a frail ceasefire.” Iran claims Lebanon is part of the ceasefire framework; the US and Israel argue it is not. This definitional dispute is a key sticking point preventing MOU signing.
Iran’s parliament speaker vowed retaliation for “clear evidence of US non-compliance with the ceasefire.” This hardline position from Iran’s legislature — which is politically independent of the executive negotiators — adds pressure against any deal being finalized quickly.
Despite the attacks, diplomatic channels have not been formally closed. Trump said he would be “in the Situation Room to make a final determination.” A senior Iranian source previously confirmed “a political understanding on the war has been reached between the two sides, but it is not yet finalized” (May 30).
Gold fell from $4,590 to $4,500 on escalation — rational price behavior. But gold did NOT crash toward $4,380 or $4,260 because: (1) the 200-day SMA at $4,411 is strong support; (2) PBoC and central banks buy on dips; (3) US CPI still at 3.8% — inflation hedge demand persists regardless of Iran.
📰 Top News Moving Gold Today
The US and Iran exchanged attacks on Monday June 1, with Israel simultaneously extending its operations in Lebanon — adding severe strain to the fragile ceasefire framework. Trump has not yet signed the MOU that would extend the truce by 60 days. Iran’s parliament speaker vowed retaliation for “clear evidence of US non-compliance.” Gold fell from Friday’s $4,590 high to the $4,500 area as safe-haven sentiment remained conflicted — escalation is bearish for ceasefire hopes but bullish for safe-haven gold directly.
The US ISM Manufacturing PMI for May 2026 releases today. FXStreet confirmed: “The ISM Manufacturing PMI is likely to provide additional support to the USD” — implying consensus expects a strong/healthy reading, which would be bearish for gold near-term by strengthening the dollar. A reading below 50 (contraction) would be the surprise that could push gold above the $4,582 SMA resistance. The PMI is the first of five key data releases this week ahead of Friday’s Non-Farm Payrolls.
FXStreet’s technical analysis confirms gold is “under pressure in the near term as price holds below the 21-day SMA at $4,582.65 and the 50-day SMA at $4,628.82.” The RSI at approximately 44 is “subdued but not extreme downside momentum” — meaning gold is not in a crash mode but lacks buying conviction. The critical floor is the 200-day SMA at $4,411.29. LiteFinance separately warns the June 2 price is “expected to decline.”
India’s Sensex fell 0.68% to 74,267 and Nifty dropped 0.72% to 23,378 on Tuesday — while gold held above ₹15,600/gram. This equity-gold divergence confirms gold’s portfolio protection role: when equities sell off on Iran fears, gold holds its value. Indian investors who allocated 5–15% of their portfolio to gold (via ETFs or SGBs) are seeing the benefit of this diversification in real time.
🚨 This Week’s Events — ISM Today, Jobs Report Friday
This is the most data-dense week of June 2026. LiteFinance confirms: “Gold prices are expected to remain highly volatile this week amid remarks by former Fed Chair Jerome Powell, the release of April JOLTS job openings data, the publication of the Fed’s Beige Book, unemployment figures, and other macroeconomic indicators.”
Five major US data releases plus ongoing Iran headline risk means gold could swing ₹2,000–₹5,000 per 10 grams across this week. The most dangerous session for physical gold buyers is Friday’s Jobs Report (6 PM IST). For jewellery needs, complete purchases by Thursday noon to avoid end-of-week volatility. For investment purchases via SGBs or ETFs, use a SIP approach and ignore weekly noise.
🔮 June 2026 Gold Forecast — LiteFinance $4,186–$4,933 Range
LiteFinance’s June 2026 forecast is notably more conservative than earlier H2 forecasts: $4,186–$4,933 range for the full month, with an estimated month-end of $4,516. Importantly, LiteFinance now states “analysts remain bearish, expecting gold to decline toward $4,370–$3,816 by year-end amid ongoing geopolitical uncertainty and the possibility of further Fed rate hikes” — a significant shift from the $5,400–$6,000 H2 target cited in May. This reflects LiteFinance’s updated assessment of the rate-hike risk.
| Institution | Target (USD) | India 24K (₹/10g) | Timeframe | View |
|---|---|---|---|---|
| Goldman Sachs | $5,400/oz | ~₹1,76,000 | End 2026 | Bull — CB buying |
| LiteFinance June | $4,186–$4,933 | ~₹1,37,000–₹1,61,000 | June 2026 range | Neutral/bearish near-term |
| LiteFinance June end | $4,516 | ~₹1,47,500 | June 30, 2026 | Slightly below current |
| LiteFinance year-end (bear) | $4,370–$3,816 | ~₹1,43,000–₹1,25,000 | End 2026 | If rate hikes materialize |
| LongForecast | Up to $6,874 | ~₹2,24,000 | 2026 peak | Bull extreme scenario |
| 200-day SMA floor | $4,411 | ~₹1,44,000 | Current long-term support | Technical floor |
LiteFinance’s shift from $5,400–$6,000 (May H2 forecast) to $4,370–$3,816 (year-end bear case) reflects the market’s evolving view that the Fed under Kevin Warsh is more likely to hike than previously expected — with December rate hike probability at ~28–50%. However, Goldman Sachs still maintains $5,400 and the bull case (stagflation + central bank buying) remains equally valid. The truth is: gold faces genuinely binary outcomes in 2026. This is exactly why a monthly SIP approach — which captures average prices across both scenarios — is superior to trying to time a lump-sum purchase.
👀 6 Things to Watch for Gold in June 2026
This is gold’s single biggest near-term wildcard. If Trump signs the 60-day ceasefire extension: oil falls sharply from $94 toward $70–$80 → inflation eases → rate hike probability falls → gold dips short-term to $4,380–$4,441, then rallies as rate cut expectations return medium-term. If he doesn’t sign: escalation risk rises, gold safe-haven demand returns.
The most data-driven event for gold this week. Weak payrolls (below 150K) = stagflation confirmed = gold above $4,582 SMA = MCX ₹1,58,000–₹1,61,000. Strong payrolls (above 250K) = rate hike November/December = gold tests $4,411 = MCX ₹1,44,000–₹1,47,000. The spread is massive — plan accordingly.
Today’s Manufacturing PMI and Wednesday’s Services PMI are the pre-NFP economic health checks. If both show contraction (below 50), stagflation is confirmed regardless of the Jobs number — a powerful bull trigger for gold. Expected to show healthy readings (bullish dollar) per FXStreet consensus.
June will see PBoC’s May gold reserve update. After April’s 8-tonne purchase (highest in 15 months), the market will watch whether China accelerated or slowed buying in May. Any acceleration would be a strong structural bullish signal, confirming the de-dollarisation thesis driving global central bank gold demand.
India’s trade deficit data for May releases in coming weeks. A widening deficit could prompt government action on the 15% gold import duty. Any reduction in duty (from 15% back toward 6%) would immediately lower India’s domestic gold prices by ₹1,000–₹1,500/gram. Any increase would raise them further. Watch RBI and government statements on bullion policy.
FXStreet confirmed: “Gold is trading above the more distant 200-day SMA at $4,411.29.” As long as gold holds above this level, the broader uptrend is mathematically intact. A weekly close below $4,411 would be a technical bear signal watched by institutional traders globally and could trigger a fresh wave of selling.
💼 How to Buy Gold in India This Week
-
Sovereign Gold Bonds (SGBs) — #1 Priority: Bypass Duty, Earn Interest
SGBs access international gold prices — bypassing India’s 15% import duty entirely. At $4,522/oz internationally, SGBs give exposure at ~₹13,760/gram equivalent vs. ₹15,621/gram retail. With Goldman Sachs targeting $5,400 year-end, SGB buyers today gain ~19.4% on international price if that target is reached, plus 2.5% annual interest, with zero capital gains tax at maturity. Given this week’s volatility (ISM today, NFP Friday), SGBs via SIP are the safest way to accumulate gold without timing risk. Visit rbi.org.in for the next tranche. -
Gold ETF Monthly SIP — Ignore the Weekly Noise
HDFC Gold ETF, SBI Gold ETF, Nippon India Gold ETF. With five major US data releases this week, trying to time the “perfect” entry is nearly impossible. A monthly SIP auto-executes on your chosen date, capturing average prices across all the volatility. Zero making charges, SEBI regulated. If you don’t have a Gold ETF SIP set up yet — open Zerodha/Groww/Upstox now and set one up for execution this week. -
Gold Mutual Funds — Perfect for Volatile Weeks
Axis Gold Fund, ICICI Pru Gold ETF FOF, Kotak Gold Fund. SIP from ₹500/month. Auto-debit. No demat account required. These funds automatically average your gold purchases across the week’s volatility. Returns mirror ETF performance minus a small expense ratio. -
Physical Gold — Wait Until After Friday’s NFP or Buy Before Thursday
At ₹15,621/gram + 3% GST + making charges, physical gold includes the full duty premium. If you need gold for a near-term jewellery need: (1) complete your purchase before Thursday noon to avoid Friday’s NFP volatility; (2) use the old-gold exchange route at Tanishq/Malabar/Kalyan to reduce duty impact; (3) consider 18K or 14K jewellery as lower-cost alternatives; (4) always demand BIS Hallmark HUID receipt. If buying purely for investment: SGBs/ETFs are cheaper by ₹1,500–₹2,000/gram.
❓ Frequently Asked Questions
On 2 June 2026, 24K gold in India is ₹15,621/gram (₹1,56,210/10g) nationally per Goodreturns. Mumbai is ₹15,622/gram, Delhi is ₹15,637/gram. 22K is ₹14,319–₹14,335/gram. 18K is ₹11,716–₹11,732/gram. Sensex: 74,267 (−0.68%). Crude: $94.68. USD/INR: ₹95.19. All rates exclude 3% GST and making charges.
Aaj 2 June 2026 ko 24 carat sone ka national bhav ₹15,621 per gram (₹1,56,210/10g) hai. Mumbai mein ₹15,622/gram aur Delhi mein ₹15,637/gram hai. 22 carat gold ₹14,319–₹14,335/gram hai. Sensex 74,267 (−0.68%) hai. Iran ceasefire aur US-Iran attacks se gold abhi $4,522 par hai. Aaj ISM PMI data release hoga. Ye rates indicative hain — 3% GST aur making charges alag lagte hain.
Gold reversed from Friday’s $4,590 high to $4,522 on June 2 because: (1) The US and Iran exchanged attacks on Monday June 1 — directly undermining the ceasefire extension framework; (2) Israel extended Lebanon operations, complicating MOU terms; (3) Iran’s parliament speaker vowed retaliation; (4) Trump has not yet signed the ceasefire MOU; (5) Technically, gold was rejected at the $4,582–$4,630 supply zone (21-day and 50-day SMAs). This pullback is corrective, not trend-reversing — the 200-day SMA at $4,411 is strong support.
LiteFinance forecasts gold to trade within the $4,186–$4,933 range in June 2026, with a possible month-end price of $4,516. On June 2 specifically, LiteFinance warns the price “is expected to decline.” Their year-end bear case is $4,370–$3,816 if Fed rate hikes materialize. However, Goldman Sachs maintains $5,400 as year-end target — the two-scenario divergence reflects genuine uncertainty about Fed policy in H2 2026.
Gold at ₹15,621/gram is approximately 4.1% below May’s Delhi peak of ₹16,265/gram and 19.3% below January’s global ATH of $5,602. The 200-day SMA at $4,411 provides a significant technical floor globally. However, with ISM PMI today and Jobs Report Friday — both capable of moving prices ±₹2,000/10g — attempting to time a lump sum this week is high-risk. Best approach: set up an SGB or Gold ETF monthly SIP this week. If you need physical gold urgently, complete the purchase before Thursday noon. Always consult a SEBI-registered financial advisor.
We’ll update gold’s response to ISM PMI today and publish the complete Non-Farm Payrolls impact analysis Friday evening (after 6 PM IST) on our WhatsApp Channel and Telegram. Daily gold & silver rates, Iran ceasefire updates & import duty news every morning!